

Tracking CA Greenhouse Gas Emissions
The california air resources board (CARB) is the government agency tasked with determining the statewide greenhouse gas (GHG) emissions inventory and updating it every five years. Initially the responsibility of the California Energy Commission, tracking responsibility of statewide emissions inventories was transferred to the air resources board in 2006. In this post we’ll start by looking at which gases are considered to have a global warming potential (GWP), what the sources of those emissions are, and then briefly describe one of the methods used for calculating statewide emissions.
CA Greenhouse Gases
Table 1 below contains a list of the 11 greenhouse gases recognized by the air resources board that originate from all anthropogenic and biogenic sources in California. This includes emissions related to imported electricity and transmission and distribution related line losses as required by California’s Global Warming Solutions Act of 2006. The GWPs contained in Table 1 are consistent with national and international standards that use values from the Intergovernmental Panel on Climate Change’s (IPCC) Fourth Assessment Report. In order to report emissions in a consistent manner across all greenhouse gases, an equivalent unit is used, MMTCO2e, million metric tons of CO2 equivalent. Emissions from any particular greenhouse gas are multiplied by the global warming potential to arrive at MMTCO2e values.
MMTCO2e = (MMT of GHG) x (GHG GWP)
To illustrate this effect of GWP, let’s take reducing methane emissions as an example. A reduction of 0.4 MMT of methane gas (approximately ¼ of total California methane emissions in 2017) would equate to a reduction of 2% of California’s total 2017 greenhouse gas emissions (424.1 MMTCO2e). In 2017, methane accounted for 8.2% of total greenhouse gas emissions. Targeting and reducing emissions from gases with high GWP can have dramatic effects on reducing overall greenhouse gas emissions.
Table 1 – IPCC Fourth Assessment Report Global Warming Potentials for California greenhouse gases
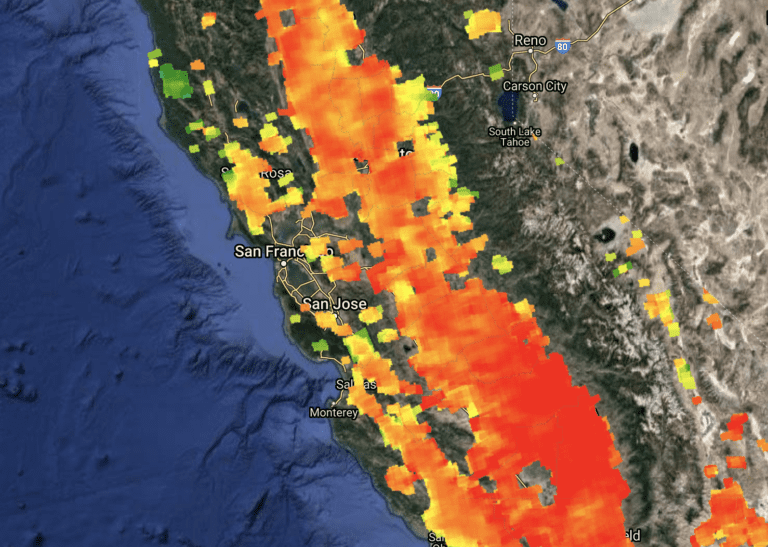
August 2020 Mean Methane Levels Across California (Min: 1600 ppbV, Max: 1900 ppbV)
Estimating CA Greenhouse Gas Emissions
Table 2 contains a breakdown of greenhouse gas emissions by scoping plan sector as provided by CARB. Transportation accounts for a major portion of the overall greenhouse gas emissions. It’s important to note here that transportation emissions represent vehicle emissions (tailpipe) only and does not include emissions from refineries and oil production that support the transportation sector. Additionally, the CARB inventory does not include natural sources of greenhouse gas emissions, e.g. methane emissions from wetlands.
CARB uses many sources to track California emissions. A particularly interesting source of data are the reports submitted to CARB due to the Mandatory Reporting Regulation (MRR). The MRR requires facilities and entities with more than 10,000 MTCO2e greenhouse gas emissions, all facilities belonging to certain industries, and all electric power entities to submit an annual greenhouse gas emissions data report directly to CARB. Any reports with emissions greater than 25,000 MTCO2e are verified by CARB accredited third-party verification entities.
Table 2 – California 2017 greenhouse gas emissions by CARB scoping plan sector.
Although many other data sources are used to arrive at a yearly emissions inventory, there is a clear challenge in validating actual greenhouse gas emissions regardless of who is reporting. There may exist an opportunity here to help account for and validate unreported or underreported emissions.
To what extent is the decision to not track emissions of less than 10,000 MTCO2e valid? How do these unreported emissions compare to those above the 10,000 MTCO2e reporting limit? In future posts we will be exploring the challenges that arise in accurately accounting for statewide emissions and how the MRR self-reporting program impacts this effort. Specifically we’ll be looking at the discrepancies between top down and bottom up emissions inventory efforts and how new emissions monitoring solutions are helpful in identifying unreported emissions throughout the state.
